




USD/JPY Price Forecast: Head-and-shoulders signals downside risk
- Head-and-shoulders pattern emerges as USD/JPY prints lower highs and lows.
- RSI trends toward 50, confirming growing bearish momentum pressure.
- Break below 158.48 exposes 157.88 and 157.35 support levels.
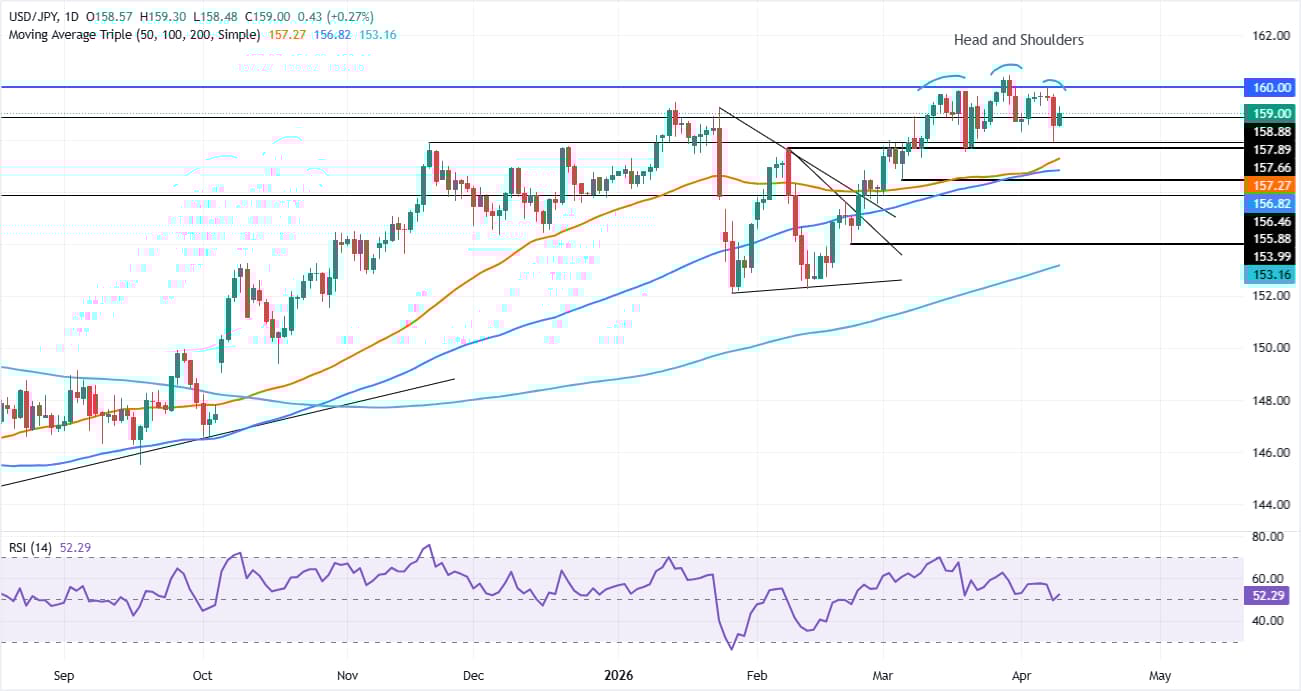
USD/JPY rises and tests the 20-day Simple Moving Average (SMA) at 159.19 on Thursday, yet it retreated amid an improvement in risk appetite, a headwind to the safe-haven appeal of the US Dollar. At the time of writing, the pair trades at 158.99, up 0.28%.
USD/JPY Price Forecast: Technical Outlook
The USD/JPY chart shows the pair is forming a quasi-head-and-shoulders pattern, which could signal further downside. Worth noting, the pair registered a lower high and a lower low after reaching a yearly peak of 161.46, an indication that in the short.-term, sellers are gathering strength.
Furthermore, the Relative Strength Index (RSI) is trending lower towards its 50-neutral level, indicating that sellers are in charge.
For a bearish continuation, the USD/JPY needs to clear the April 9 daily low of 158.48. Once surpassed, the path to challenge the April 8 swing low of 157.88 increases. Below here, fresh buying pressure is seen at the 50-day SMA at 157.35, ahead of the 100-day SMA at 156.85.
Conversely, if USD/JPY breaks past the 20-day SMA at 159.19, it exposes the pair to selling pressure around 160.00, a line in the sand for Japanese authorities to increase their intervention threats. Hence, the USD/JPY remains capped on the upside. But if market mood remains optimistic, the downside risks emerge, further underpinned by falling US bond yields.
USD/JPY Price Chart — Daily
Japanese Yen Price This week
The table below shows the percentage change of Japanese Yen (JPY) against listed major currencies this week. Japanese Yen was the strongest against the US Dollar.
| USD | EUR | GBP | JPY | CAD | AUD | NZD | CHF | |
|---|---|---|---|---|---|---|---|---|
| USD | -1.53% | -1.80% | -0.41% | -0.88% | -2.78% | -2.92% | -1.30% | |
| EUR | 1.53% | -0.26% | 1.15% | 0.65% | -1.25% | -1.40% | 0.22% | |
| GBP | 1.80% | 0.26% | 1.35% | 0.91% | -0.99% | -1.13% | 0.52% | |
| JPY | 0.41% | -1.15% | -1.35% | -0.48% | -2.37% | -2.50% | -0.92% | |
| CAD | 0.88% | -0.65% | -0.91% | 0.48% | -1.90% | -2.02% | -0.41% | |
| AUD | 2.78% | 1.25% | 0.99% | 2.37% | 1.90% | -0.14% | 1.52% | |
| NZD | 2.92% | 1.40% | 1.13% | 2.50% | 2.02% | 0.14% | 1.67% | |
| CHF | 1.30% | -0.22% | -0.52% | 0.92% | 0.41% | -1.52% | -1.67% |
The heat map shows percentage changes of major currencies against each other. The base currency is picked from the left column, while the quote currency is picked from the top row. For example, if you pick the Japanese Yen from the left column and move along the horizontal line to the US Dollar, the percentage change displayed in the box will represent JPY (base)/USD (quote).
Recommended Articles


