


Dow Jones Industrial Average enters correction territory as Hormuz fears fuel selloff
- The Dow fell over 1% on Friday and entered correction territory, down 10% from its recent high.
- Brent crude surged above $110 per barrel after incidents in the Strait of Hormuz disrupted tanker flows.
- University of Michigan consumer sentiment fell to 53.3, while one-year inflation expectations jumped to 3.8%.
- Rate futures markets priced in a greater than 50% probability of a Federal Reserve rate hike by year-end for the first time.
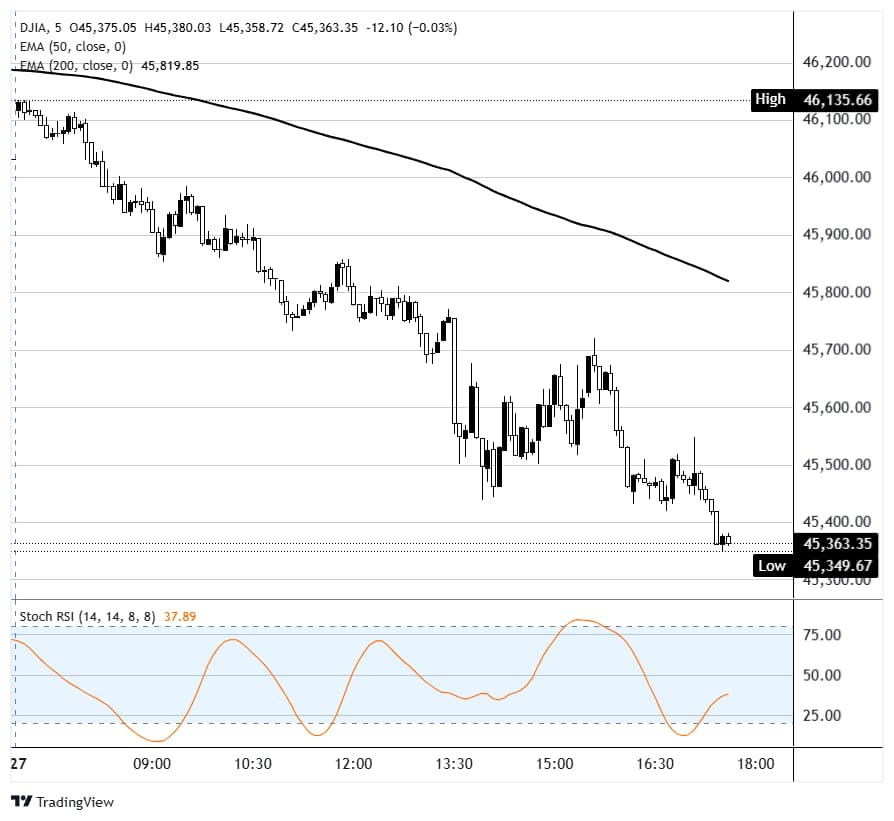
The Dow Jones Industrial Average tumbled on Friday, shedding roughly 510 points or 1.1% to fall below 45,500 and officially enter correction territory. The S&P 500 lost around 1%, bringing its decline from its record high to over 8%, while the Nasdaq Composite dropped 1.3% after entering correction territory a day earlier. Friday's slide capped a fifth consecutive weekly decline for the broad market, the longest losing streak since 2022, as Strait of Hormuz disruptions and fading confidence in a diplomatic resolution with Iran kept risk appetite firmly in check.
Strait of Hormuz disruptions rattle energy markets
Oil prices surged on Friday as shipping through the Strait of Hormuz came under direct threat. Iran's Islamic Revolutionary Guard Corps (IRGC) said the waterway is effectively closed and warned that any movement through it would face a harsh response. Two Chinese-flagged vessels were turned away early Friday, and a Thai-flagged cargo ship that was struck in the strait ran aground, according to Iranian state media. International benchmark Brent crude jumped around 3% to trade above $110 per barrel, while US West Texas Intermediate (WTI) climbed roughly 4% to near $100. The disruption to what is the world's most critical Oil chokepoint is the most tangible supply threat since the US-Iran conflict began on February 28.
President Trump extended his deadline to resume strikes on Iranian energy infrastructure to April 6, posting on Truth Social that talks are "ongoing" and "going very well." Markets were unimpressed. Iran's foreign minister reportedly told state media this week that Tehran has no intention of holding direct talks with the US, and The Wall Street Journal reported the Pentagon was considering deploying an additional 10K troops to the Middle East.
Consumer sentiment drops as inflation expectations spike
The University of Michigan (UoM) consumer sentiment survey for March painted a bleak picture. The headline index fell to 53.3 from 55.5 in February, missing the consensus estimate of 54.0 and marking its lowest reading in months. The expectations component was even weaker, tumbling 8.7% to 51.7 against a consensus of 54.1. Most concerning for markets was the one-year inflation expectations reading, which jumped to 3.8% from 3.4% the prior month, well above the 3.4% consensus. Five-year expectations held steady at 3.2%.
The combination of deteriorating consumer confidence alongside rising inflation expectations feeds directly into the stagflation narrative that has increasingly gripped Wall Street since the Iran war pushed Oil prices above $100 earlier this month. The Organisation for Economic Co-operation and Development (OECD) added fuel to that concern this week, raising its US inflation forecast for 2026 to 4.2% — far above the Federal Reserve's (Fed) own projection of 2.7%.
Rate hike odds cross 50% for the first time
In what may be the most significant shift in rate expectations since the Iran conflict began, traders in the futures market pushed the probability of a Fed rate hike by the end of 2026 to 52% on Friday morning, according to the CME FedWatch tool. It was the first time the threshold had crossed 50%, a remarkable turnaround from the start of the year when three rate cuts were fully priced in. The Fed currently holds its target rate at 3.50% to 3.75% after pausing at its March meeting, with the next Federal Open Market Committee (FOMC) decision on April 29-30.
Surging energy prices, the Bureau of Labor Statistics (BLS) reporting that import prices jumped 1.3% in February, and a strengthening US Dollar have all contributed to the hawkish repricing. Gold, typically a beneficiary of uncertainty, remained under pressure near $4,400 per ounce, well off its January record highs, weighed down by rising real yields and the prospect of tighter monetary policy.
Tech stocks extend losses on legal and AI headwinds
The technology sector continued to bear the brunt of the risk-off mood. Meta (META) fell around 2.4% on Friday after plunging nearly 8% on Thursday following a landmark jury verdict in Los Angeles that found both Meta and Alphabet (GOOGL) negligent in a social media addiction lawsuit. A separate New Mexico jury hit Meta with $375 million in civil penalties earlier in the week. The rulings, which both companies plan to appeal, represent a potential shift in legal liability for tech platforms and could influence thousands of similar cases. Alphabet slipped around 1.3%, while Microsoft (MSFT) shed roughly 2%. Memory chip stocks extended their selloff after Alphabet's new TurboQuant algorithm showed it could significantly reduce the amount of memory required by artificial intelligence models, hitting Micron Technology (MU) particularly hard: shares have dropped nearly 20% over the past five trading days. China's decision to open a trade probe against the US in retaliation to tariffs added another layer of pressure on global tech supply chains.
Energy and defensives outperform in risk-off session
While the broader market sank, pockets of strength emerged in corners of the market that benefit from elevated Oil prices and defensive positioning. Chevron (CVX) gained over 1%, continuing a strong run for the energy sector since the Iran conflict began. Verizon (VZ) and Walmart (WMT) also posted modest gains on the session, reflecting a rotation into lower-beta names as investors brace for more volatility heading into the weekend. The CBOE Volatility Index (VIX) spiked above 27, up roughly 8%, underscoring the elevated level of fear across markets. With the Trump administration's extended April 6 deadline looming and no clear path to a diplomatic resolution in sight, traders face another weekend of headline risk. Next week brings the end of the quarter, where portfolio rebalancing could add to choppiness, and the March Nonfarm Payrolls (NFP) report on April 3 will provide the next major read on the labor market.
Dow Jones five-minute chart
Dow Jones FAQs
The Dow Jones Industrial Average, one of the oldest stock market indices in the world, is compiled of the 30 most traded stocks in the US. The index is price-weighted rather than weighted by capitalization. It is calculated by summing the prices of the constituent stocks and dividing them by a factor, currently 0.152. The index was founded by Charles Dow, who also founded the Wall Street Journal. In later years it has been criticized for not being broadly representative enough because it only tracks 30 conglomerates, unlike broader indices such as the S&P 500.
Many different factors drive the Dow Jones Industrial Average (DJIA). The aggregate performance of the component companies revealed in quarterly company earnings reports is the main one. US and global macroeconomic data also contributes as it impacts on investor sentiment. The level of interest rates, set by the Federal Reserve (Fed), also influences the DJIA as it affects the cost of credit, on which many corporations are heavily reliant. Therefore, inflation can be a major driver as well as other metrics which impact the Fed decisions.
Dow Theory is a method for identifying the primary trend of the stock market developed by Charles Dow. A key step is to compare the direction of the Dow Jones Industrial Average (DJIA) and the Dow Jones Transportation Average (DJTA) and only follow trends where both are moving in the same direction. Volume is a confirmatory criteria. The theory uses elements of peak and trough analysis. Dow’s theory posits three trend phases: accumulation, when smart money starts buying or selling; public participation, when the wider public joins in; and distribution, when the smart money exits.
There are a number of ways to trade the DJIA. One is to use ETFs which allow investors to trade the DJIA as a single security, rather than having to buy shares in all 30 constituent companies. A leading example is the SPDR Dow Jones Industrial Average ETF (DIA). DJIA futures contracts enable traders to speculate on the future value of the index and Options provide the right, but not the obligation, to buy or sell the index at a predetermined price in the future. Mutual funds enable investors to buy a share of a diversified portfolio of DJIA stocks thus providing exposure to the overall index.
Recommended Articles


